Obama vs. Paul Ryan Budget Plan: Interactive Graph

Author: Wes Messamore
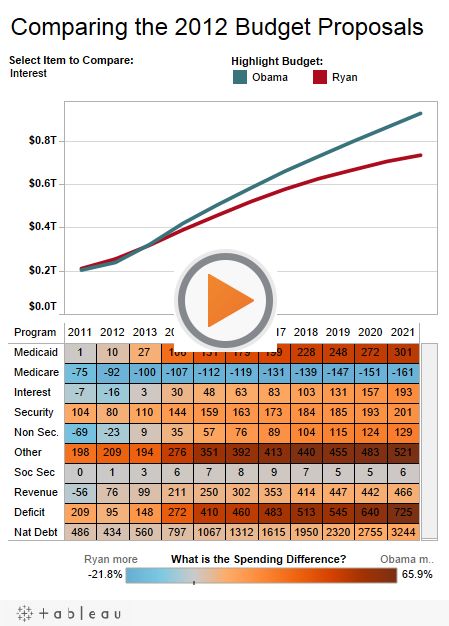
The following interactive graph for comparing the Paul Ryan and Barack Obama budget proposals is pretty nifty. Here's how to read it:
Select from the dropdown box for a list of items you can chart. You can also hover over any of the orange or blue boxes for a popup display comparing the budgetary difference between the Obama and Ryan proposals for that year, for that item. Boxes in blue are years in which Paul Ryan has budgeted more for an item than President Obama. Boxes in Orange are the reverse. Straight Up Comparison Numbers for President Obama come from Whitehouse Budget Summary Tables page 174 (PDF page 6). Numbers for Paul Ryan come from Path to Prosperity Table S-3 on PDF page 64. The category items are identical except Ryan has an extra item for Global War on Terror. To equalize, we added Global War on Terror to Security. Without making any judgment to the contrary, let's assume Ryan and Obama can both "deliver". Here are a few charts depicting the results.
What strikes me is how closely so many of these line graphs trend together. Then note on Medicare, that far from pushing grandma off a cliff, the graph looks like Ryan is pushing her uphill. His plan spends even more than Obama's! Just another example of reality and rhetoric not matching up. This is why it's important to look at cold, hard facts like numbers on "boring" graphs instead of just reading bumper stickers and listening to talking heads argue.
Have at it:
Interactive graph by: Tableau Software
Hat tip: Zero Hedge for the good find
Latest articles
Yes, Elections Have Consequences -- Primary Elections to Be Specific
Can you imagine a Republican winning in an electoral district in which Democrats make up 41% of the registered electorate? Seems farfetched in much of the country. As farfetched as a Democrat winning in a R+10 district....
16 November, 2024
-
5 min read
Why Did Donald Trump Win?
Former and future President Donald Trump's decisive 2024 win with 312 electors (to Harris’ 226) and 50.1% of the votes nationwide (to Harris' 48.3%) was a resounding victory. ...
16 November, 2024
-
7 min read
More Choice, Better Representation: Portland Voters Use Ranked Choice Voting for First Time
This year, Portland, Oregon used ranked choice voting (RCV) for the first time after voters approved the reform in 2022. Portlanders used RCV to elect all city officials – including a new mayor, and twelve new councilmembers from four 3-member districts using the proportional form of RCV. The reform is already proving its ability to provide better representation and promote effective governance....
15 November, 2024
-
5 min read


